Different image patterns were used to examine their fourier transforms. Their fourier transforms were displayed by taking its modulus.
 Square Aperture
 fft2() of the Square Aperture
 Circular Aperture
 fft2() of the Circular Aperture
 Square Annulus
 fft2() of Square Annulus
 Two slits along x-axis
 fft2() of Two slits along x-axis
 Two dots
 fft2() of Two dots.
To investigate in this property, a 2D sinusoid was used. This pattern is along the x-direction and is similar to the corrugated roof.
Using this code for sine:
z = sin(2*%pi*f*X);

Shown above is the pattern for the corrugated roof sinusoid with f = 1.

fft2() of the sinusoid.
By varying the value of f with values [0.5, 1, 15.14, 29.28, 43.42], the fft2() for looked like this:
 f = 0.5
 f = 1
f = 1
 f = 15.14
 f = 29.28
 f = 43.42
 f = 0.5
 f = 1
f = 1 f = 15.14
 f = 29.28
 f = 43.42
It seems that the separation is periodic too.
Since digital images have no negative values, a certain bias must be added to make those negative values readable. So, in the sinusoid generated with f = 10, a constant bias was added that is equal to 1. Taking its fft2(), it yielded this image.
 Sinusoid with f = 10 and bias = 1.
 fft2() of the generated sinusoid.
 rotated 30 degrees
 rotated 60 degrees
 rotated 90 degrees
 rotated 180 degrees
Taking their fft2(), it produced these images:
 fft2() of rotated 30 degrees
 fft2() of rotated 90 degrees
 fft2() of rotated 90 degrees
 fft2() of rotated 180 degrees
 rotated 30 degrees
 rotated 60 degrees
 rotated 90 degrees
 rotated 180 degrees
By taking their fft2(), it yielded these images:
 fft2() of combination sinusoids rotated 30 degrees
Since digital images have no negative values, a certain bias must be added to make those negative values readable. So, in the sinusoid generated with f = 10, a constant bias was added that is equal to 1. Taking its fft2(), it yielded this image.
 Sinusoid with f = 10 and bias = 1.
 fft2() of the generated sinusoid.
It is observed that there is a bright spot in the center. To be able to obtain the frequency of the pattern given an interferogram in the Young's double slit experiment, it can be regarded that the obtained fft2() is an interferogram. The bright spot in the center is filtered to be able to show the two dots obtained.These two dots contains the information needed to obtain the frequency. The frequency is related to the distance of the two dots.
Rotating the sinusoid patterns gave these images:
Rotating the sinusoid patterns gave these images:
 rotated 30 degrees
 rotated 60 degrees
 rotated 90 degrees
 rotated 180 degrees
Taking their fft2(), it produced these images:
 fft2() of rotated 30 degrees
 fft2() of rotated 90 degrees
 fft2() of rotated 90 degrees
 fft2() of rotated 180 degrees
Using a combination of sinusoids in which the first one tranverses in the x-direction and the other one in the y-direction. It gave this fft2();
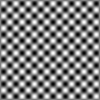 Combination of sinusoids in X and Y axes.
  fft2() of combination of sinusoids in X and Y axes.
 Combination of sinusoids in X and Y axes.
 fft2() of combination of sinusoids in X and Y axes.
rotating them gave these results:
 rotated 30 degrees
 rotated 60 degrees
 rotated 90 degrees
 rotated 180 degrees
By taking their fft2(), it yielded these images:
 fft2() of combination sinusoids rotated 30 degrees
fft2() of combination sinusoids rotated 60 degrees

fft2() of combination sinusoids rotated 90 degrees
fft2() of combination sinusoids rotated 180 degrees
Their fft2() is like the previous part of the single sinusoid rotated with the mirror projection of to the other side that resulted to a box with varying length and width.
I'd give myself 9/10 for this activity. It was really fun.
I'd give myself 9/10 for this activity. It was really fun.